NEWS
Tuesday 17 November 2020
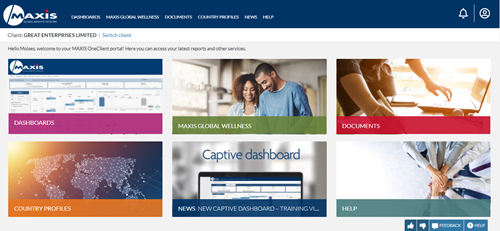
We have launched a suite of new data and digital services on our OneClient portal, including interactive dashboards for captive and Global Risk Solution (GRS) clients. Other developments include improved pooling dashboards and upgrades to make the portal even easier to use.
We relaunched our OneClient portal in 2019 with new state-of-the-art analytics tools to give our global multinational clients unparalleled access to comprehensive claims reports, programme performance metrics, market analytics and intelligence. The interactive dashboards and reporting on the OneClient portal allows multinationals to analyse the performance of their global programme and address the biggest cost drivers.
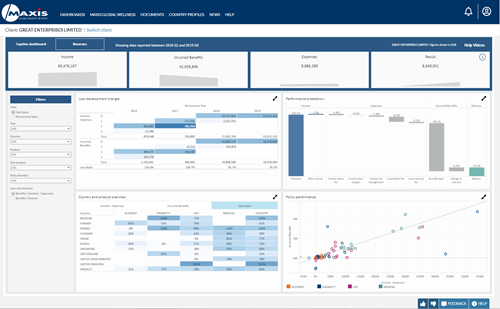 One of the key upgrades for 2020 is the new captive dashboard. This interactive dashboard, available for all our captive clients, provides the latest quarterly data and enables more in-depth insight to the captive programme performance.
The new dashboard includes filters by year, country, product, sub-product and policy. It provides views of the programme on a reinsurance or cash basis, and allows selection between two loss ratio formulas. A loss development triangle enables clients to evaluate risks and liabilities along with an assessment of premium and reserve levels.
Enhanced data visualisations allow loss ratios to be displayed as an interactive heatmap by country and product, and provide a complete performance breakdown of a captive, including income, expenses and incurred benefits. The interactive graphs enable the captive client to identify outliers and badly performing policies.
Helga Viegas, Director of Digital & Innovation, MAXIS Global Benefits Network, said: “The interactive captive dashboard was a much-awaited development after the successful launch of our pooling dashboard last year. We’re constantly investing in our suite of digital solutions to ensure our multinational clients have the right tools to manage their investment in EB. Through these digital tools and dashboards, we help clients to better understand the drivers of spend and develop strategies and interventions to help reduce costs in future.”
Alongside the captive dashboard, we are launching a new interactive GRS dashboard, which allows clients to better understand their GRS performance over their three-year cycle and make decisions for the future. The data visualisations provide an easy-to-use snapshot of the GRS, highlighting overall performance, premium and expenses distribution, loss ratio heatmaps, results and reserves overview, among other visualisations. The dashboard allows clients to filter and drill-down by country and product, getting a deeper understanding of performance drivers.
The interactive dashboard for pooling clients has also been upgraded to improve navigation and make it even easier to analyse. Pooling clients will also be given access to a new section of the portal where they can manage new local policies potentially being added into their global programme. This involves the ability to review new local policies, exclude specific ones and download information about policies previously added.
 Other new functionalities include automatic email notifications when there are new documents added to a client’s account, a new email preference centre and a news section featuring MAXIS news and industry updates specifically tailored for multinational clients.
Demonstrations of the OneClient portal are available upon request.
For media enquiries please contact
Charlotte Pascal / Hugh Fasken
Citigate Dewe Rogerson –[email protected]